Isotope tracing
Isotope tracing is planned for the metabolic process and experimental model. Suitability of the ¹⁸O- or ¹³C-based approaches described in our service scope is assessed for each application.

Metabolite levels and metabolic flux provide different information. Fluxomics measures the turnover of metabolic reactions within a living cell or organism over time. Fluxomics brings together tracing strategy, sampling design and data analysis to investigate pathway dynamics.
Discuss your project ↗Isotope tracing is planned for the metabolic process and experimental model. Suitability of the ¹⁸O- or ¹³C-based approaches described in our service scope is assessed for each application.
Target pathways, sampling times and required measurements are defined from the research question. Concentration data alone are not interpreted as flux measurements.
Interpret data in the context of metabolic turnover and pathways, considering the tracing approach and computational scope.
Compare isotope labelling and, where appropriate, plan model-based flux estimation.
Share the tracer, medium, exposure duration, sampling times and experimental groups in advance.
Isotopologue tables, labelling plots and a method summary as agreed; modelling may be a separate work item.
Labelling distributions are not direct flux rates. Data sufficiency and model requirements are evaluated for flux estimation.
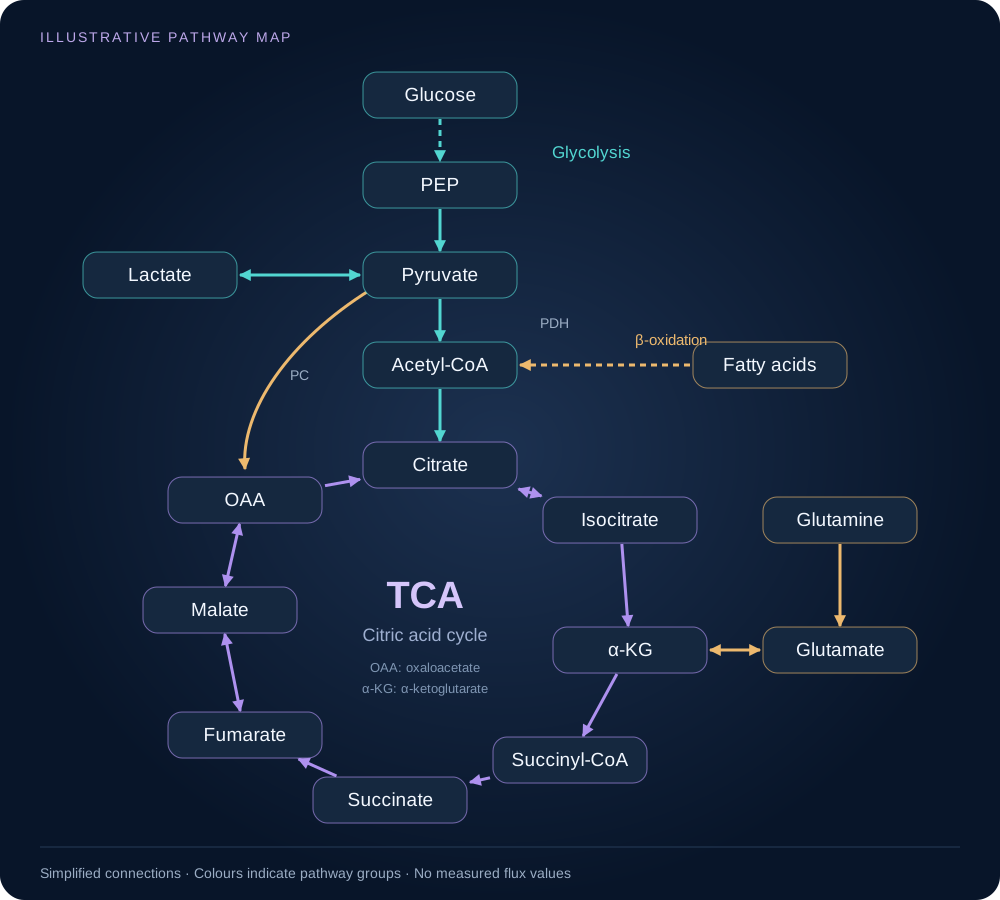
Explore glycolysis, the TCA cycle and connected carbon sources in one map. Isotope tracing and modelling help investigate the dynamics of these connections.
Isotope tracing · Pathway mapping · Metabolic flux assessment
Research question, samples, study groups and replicates.
Sample preparation, analytical approach and reporting plan.
Agreed analyses and scope of biological interpretation.
Share your research question, analysis or manufacturing requirements. Attach drawings and relevant files to your email.